
Sometimes seeing stuff that is hidden in easily and publicly available data is hard. The data I have in mind today is the age pyramid, which, when depicted graphically, magically manages to hide all the scary stuff going on.
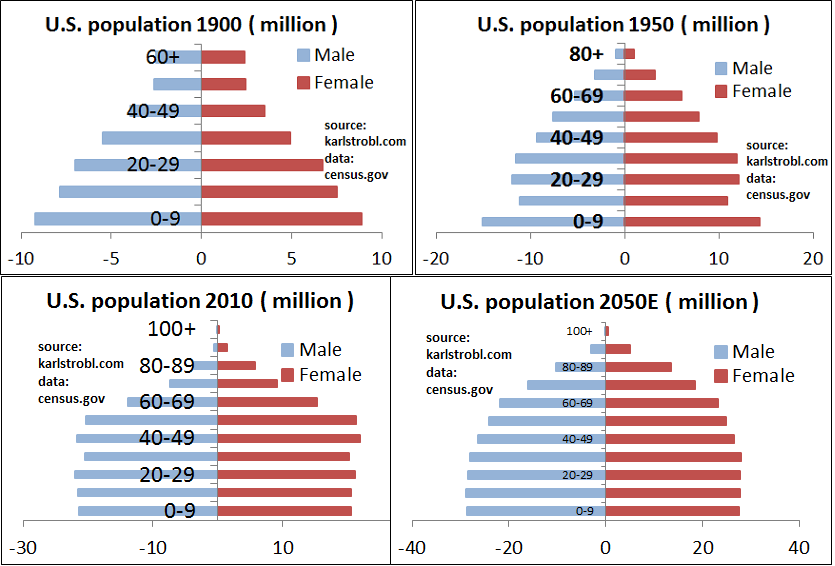
So, let’s get right into the “now you see it … now you don’t” game. Age pyramids of the US population in 1900, 1950, and 2010, and the predicted one for 2050, look like this [1] :
Yawn… Anything in there you din’t expect?
- Few children aged 10-19 in 1950. These would have been born between 1931 and 1940, during or right after the Great Depression. no surprise
- There is a baby-boomer bulge of 40-60 year olds in 2010. no surprise
I dare you to find stuff you didn’t expect. Look closely, take time.
If you din’t find anything, here is how all the fun stuff got hidden:
- The x-axes aren’t comparable, so you can’t easily see population growth between the periods, especially not of any particular age group.
- The y-axes aren’t comparable either, so you can’t see the real dynamics of the oldest: In 1900, the oldest age group in the data was called “60+”, in 1950, the oldest group found in the data was “80+”, and in 2010 it was “100+”. There’s some stuff hiding in there too.
So let’s simply show everything on identical scales. So “60+” is the oldest group, to create comparability with 1900, and 70 million (!) has to be the x axis to accommodate the 61 million women over 60 in 2050:
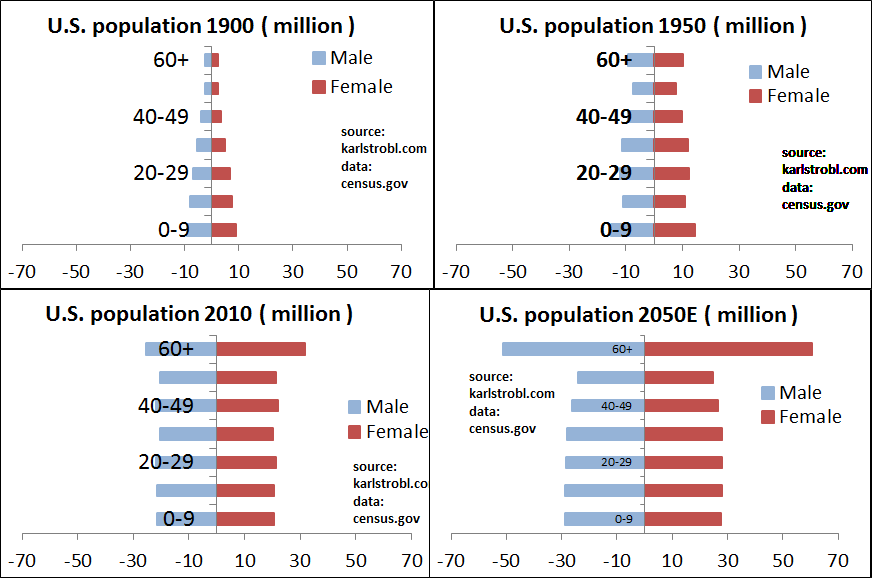
What we call the age pyramid really looks like a one-legged table, for someone who grew up in the Great Depression.
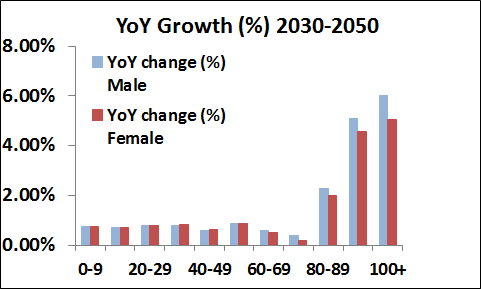
For more magic, let’s plot year-on-year growth / shrinkage of each population segment. Remember, it’s all from precisely the same data! It is all a simple do-it-yourself exercise to transform one depiction into the other. I just haven’t seen it anywhere, so I just did it myself.
Most of the 20th century (1900-1990), the compound annual growth rate of the US population was 1.35%, divided into age groups like this

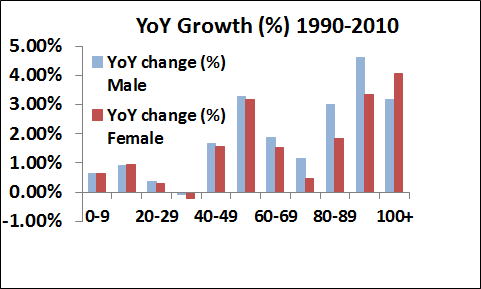
From 1990 to 2010, so roughly the last 20 years, overall growth had slowed to 1.1%, distributed in a way where we were — relatively speaking — short young workers, as the baby boomers moved up the career ladder into their 40s and 50s:
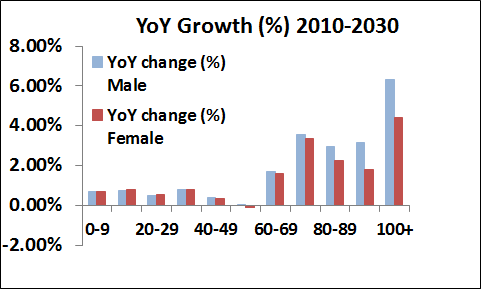
In the period 2010-2030 that is mostly still ahead of us, this translates directly into a shrinking 40-60 age group. Persons who were 20-40 some twenty years ago, are now 40-60. No-one gives birth to them any more, so they are still too small a group compared to all other age groups.We are losing the high value tax payers in the next 20 years, while the the population is still growing at a rate of 0.93% overall:
From a purely fiscal perspective this is worse than what is normally expressed in a standard dependency ratio analysis:
We are ill prepared for the demographic brink of 2010-2030 because the past is not a good guide. The worsening dependency ratios of the 20th century are a doddle compared to what’s in store in the next 20 years.
The rate of the rise of the dependency ratio is accelerating for 2010-2030, and it is not just because the baby boomers create more new retirees per year than ever before. It is also because the “wake” between the boomers and the echo boomers, which will be the high-value tax payers is growing far slower than any other population segment.
This will of course be primarily a fiscal problem, and not just in the US.
The good news: In 20 years, we finally settle into a new normal, with almost homogeneous growth across all sub-70 age groups
The bad news, there will be no new normal for Europe as far as the demographers eye can see (i.e. at least 2050). But that’s the subject of a future post.
—————-
[1] The data is all taken from the IDB information gateway of the US census:
